QUICK INFO
| Difficulty | Beginner |
| Time Required | 15-20 minutes |
| Prerequisites | Google account, basic understanding of brand guidelines |
| Tools Needed | Gemini app (free tier works), brand color codes (hex values) |
What You'll Learn:
- Build a reusable style specification that produces consistent infographic outputs
- Structure prompts that prevent the cluttered, clip-art look typical of AI infographics
- Iterate on generated images without starting from scratch each time
- Adapt the method for different content types (data summaries, process flows, comparisons)
GUIDE
Create Brand-Consistent Infographics with Gemini's Nano Banana Pro
Turn article content into shareable infographics that match your visual identity.
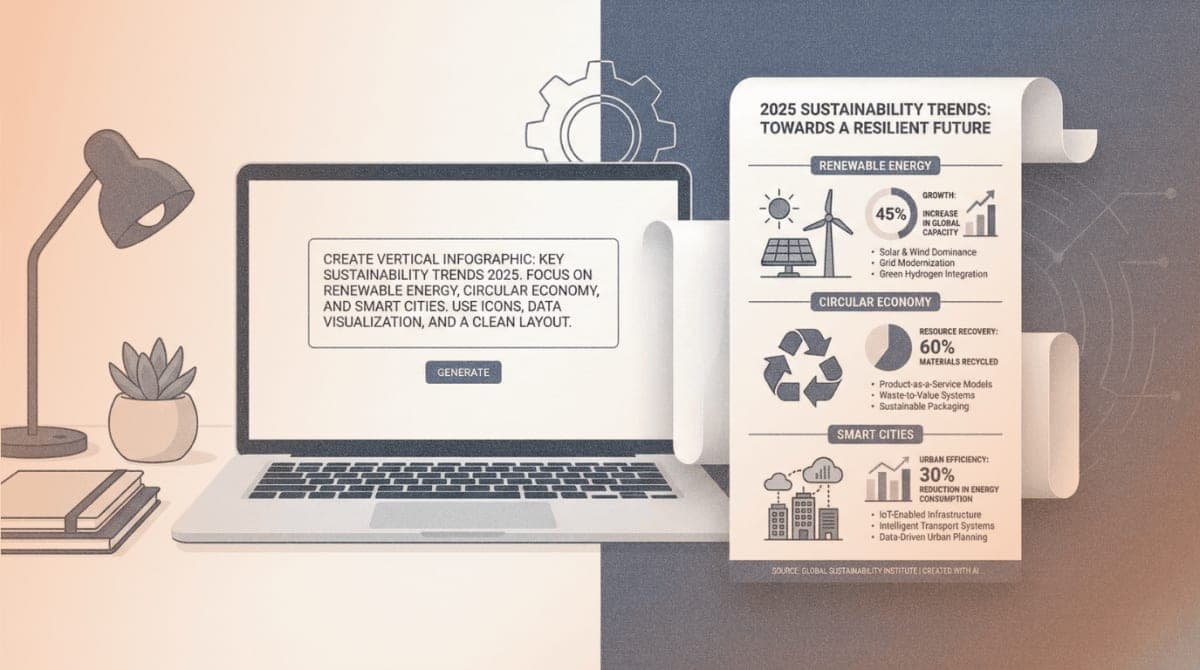
Default AI infographics look like stock templates: random colors, inconsistent iconography, and text that fights for attention. This guide covers a prompting method that produces infographics matching your brand palette, typography preferences, and illustration style. The technique works in the free Gemini app.
Getting Started
You need three things before writing your first prompt:
Gemini access: Open gemini.google.com or the Gemini app. Free accounts work for this workflow, though images include a small watermark in the corner.
Brand specifications: Gather your hex color codes (primary, secondary, background), preferred font style descriptions, and any reference infographics you want to emulate.
Source content: The text, data, or concepts you want visualized. Articles, reports, and bullet-point lists all work.
To use the latest image model, include "use Nano Banana Pro" in your prompt. This activates Gemini 3's image generation capabilities, which handle text rendering and spatial layouts far better than previous versions.
The Two-Part Prompt Method
Requesting an infographic in a single prompt produces unpredictable results. Split your request into two distinct prompts for consistent output.
Part 1: Establish the Style Specification
Your first prompt defines the visual rules. Send this before mentioning your actual content:
Create infographics using these specifications:

FORMAT
- Aspect ratio: 9:16 (vertical)
- Resolution: 1080x1920 pixels
- Background: #F5F5F5 (light warm gray)

COLOR PALETTE
- Primary: #2563EB (blue)
- Secondary: #10B981 (green), #F59E0B (amber)
- Text: #1F2937 (near-black)

TYPOGRAPHY
- Headlines: Bold sans-serif, 48pt equivalent
- Body text: Regular sans-serif, 24pt equivalent
- All text must be legible and correctly spelled

LAYOUT
- Maximum 4 content sections
- Generous whitespace between elements
- Title positioned in top 15% of frame
- Clear visual hierarchy from top to bottom

ILLUSTRATION STYLE
- Minimal line-art icons
- No clip-art or 3D renders
- Flat color fills only
- Consistent stroke weight across all icons

Confirm you understand these specifications before I provide the content.
Gemini will acknowledge the specifications. This conversation context persists for subsequent prompts.
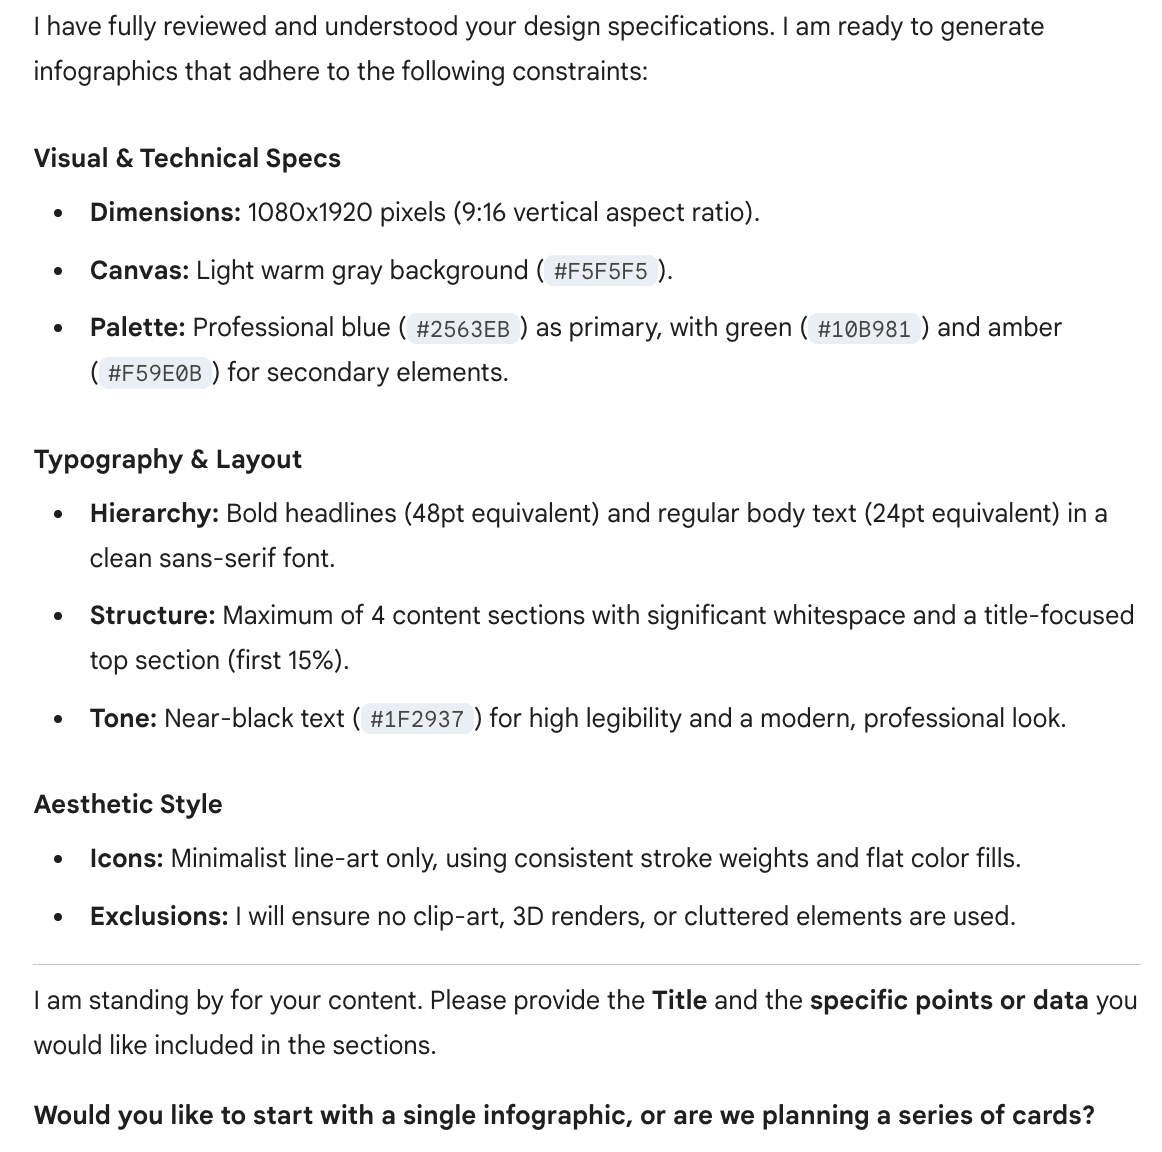
Expected result: Gemini confirms it understands the style guide and is ready for content.
Part 2: Provide Your Content
Send your second prompt with the actual information:
Use Nano Banana Pro to create an infographic with these specifications.

TITLE: [Your headline here]

CONTENT:
[Paste your key points, statistics, or process steps here]

Generate the infographic now.
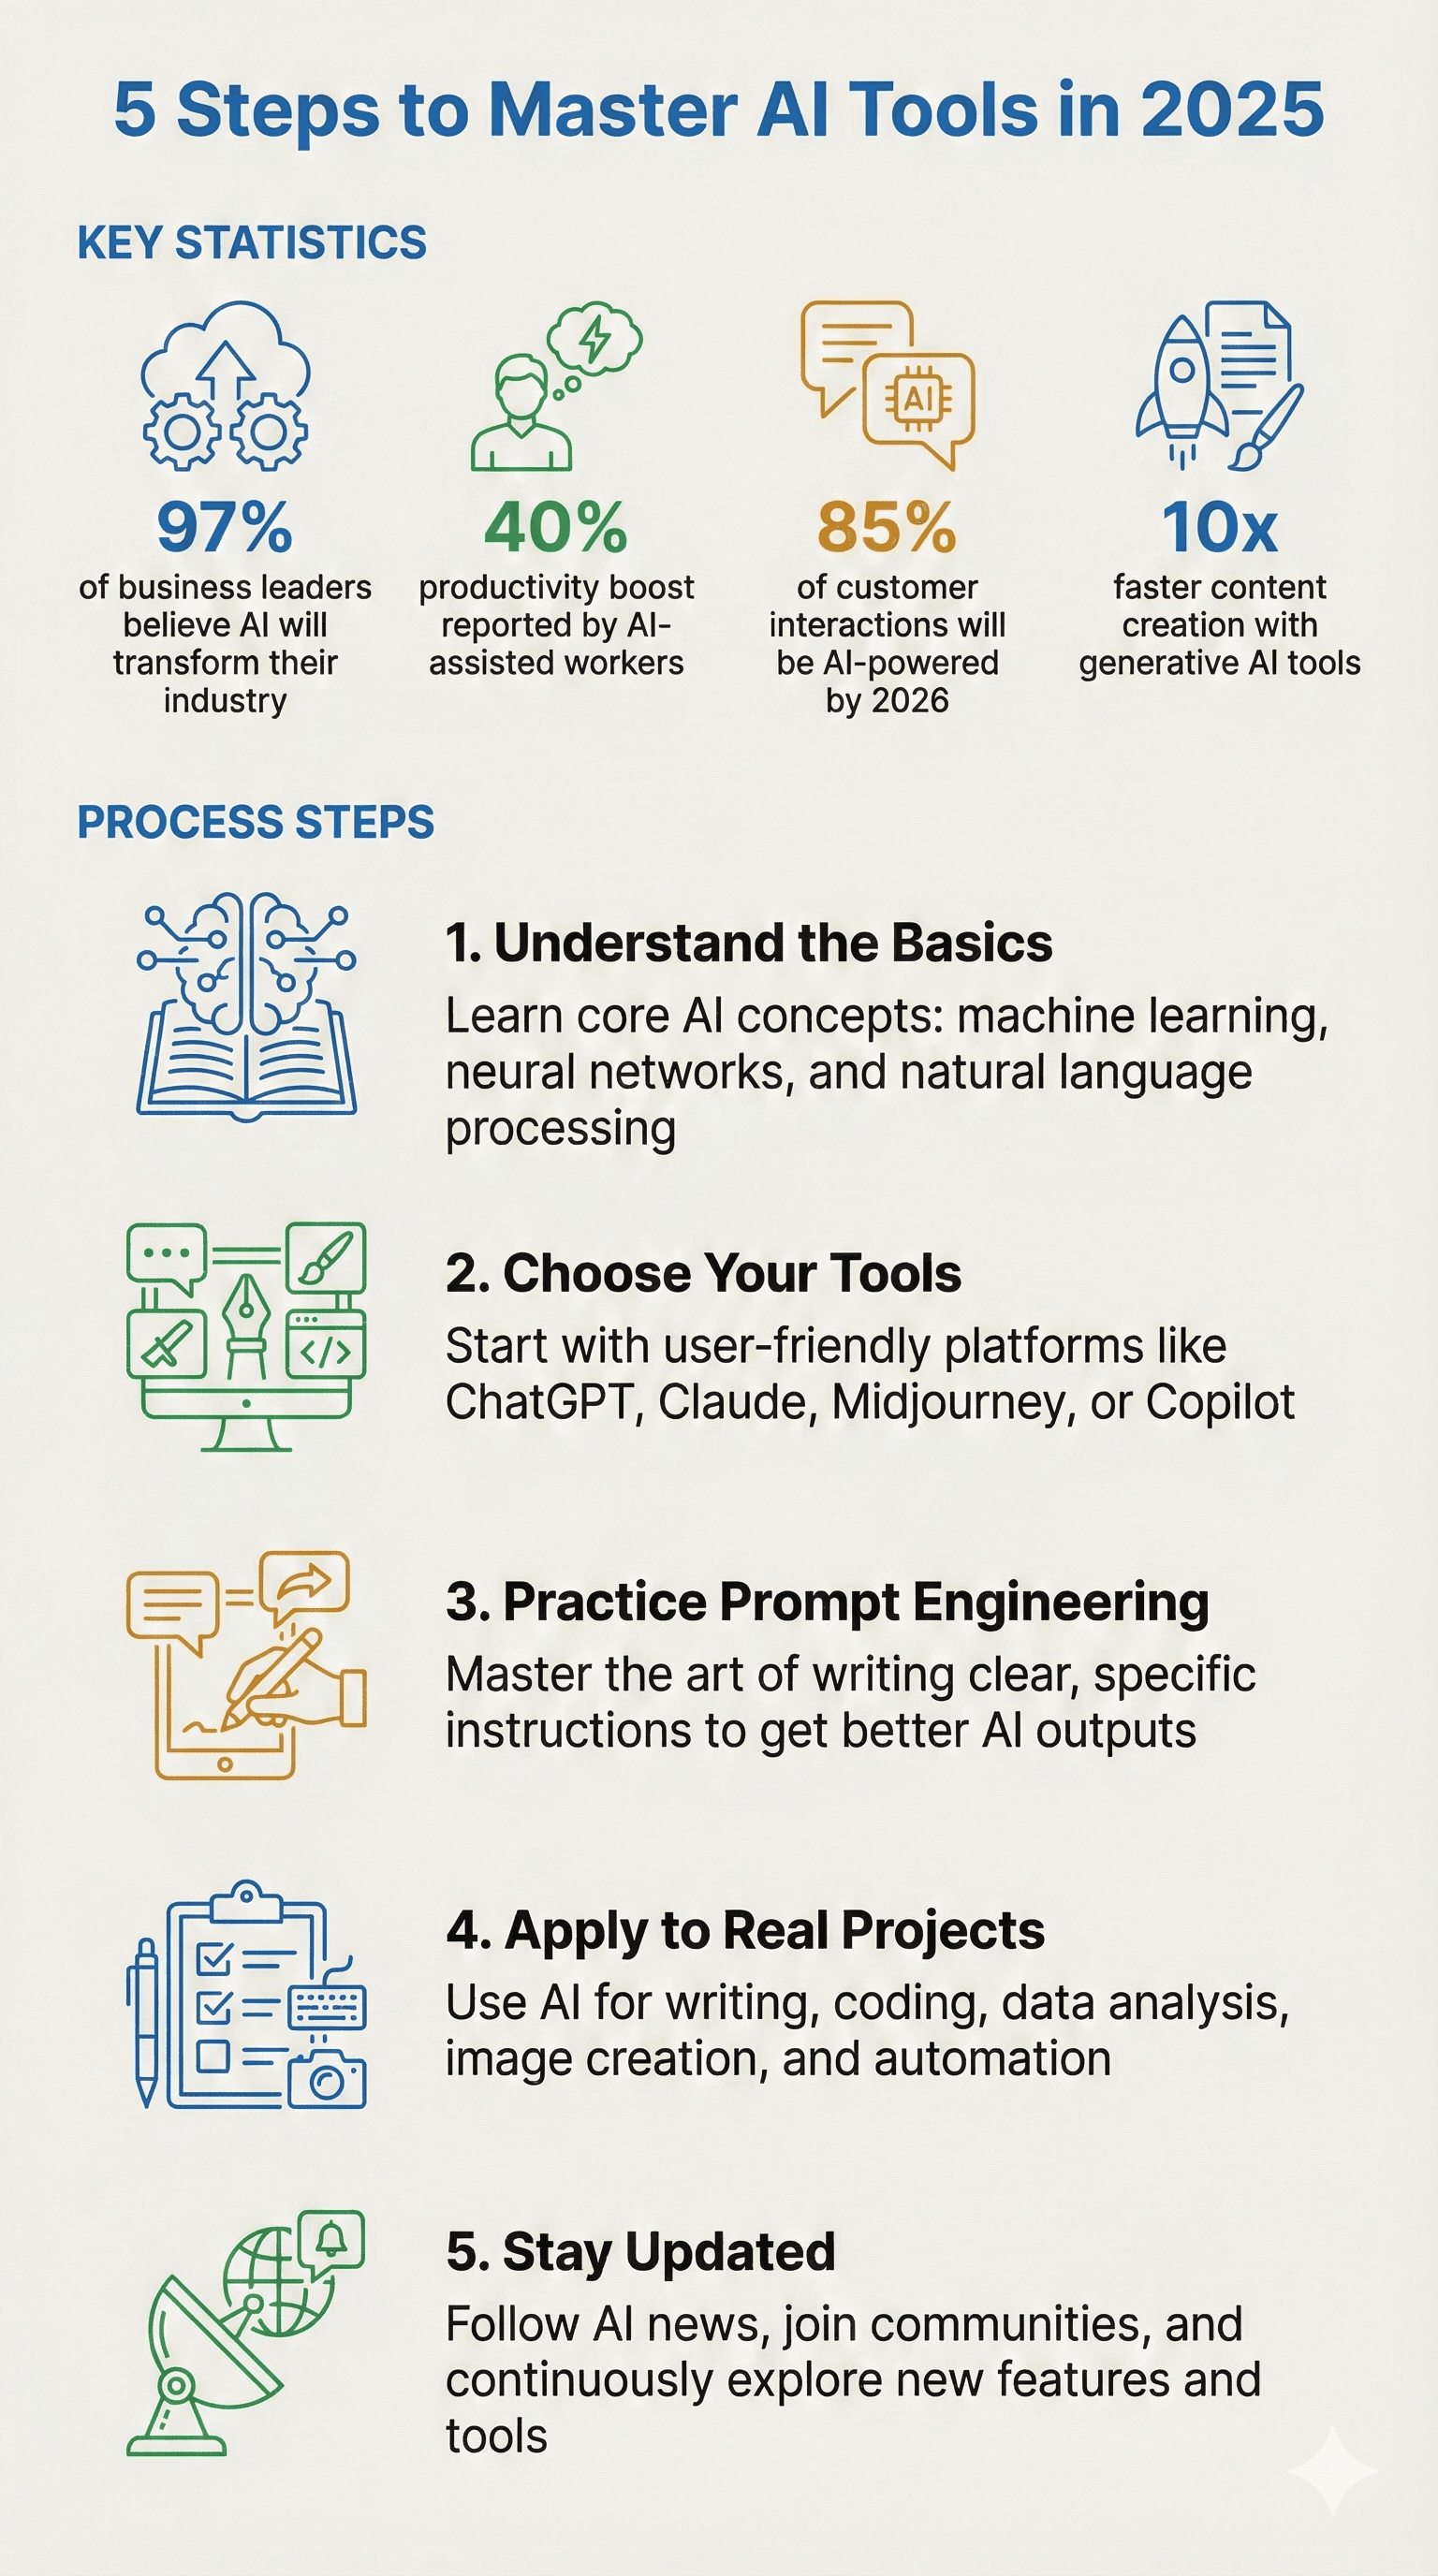 Expected result: An infographic matching your color palette, with properly rendered text and the layout structure you specified.
Building Your Style Specification
The style specification is where most infographic quality is determined. Each component addresses a specific failure mode in AI-generated visuals.
Aspect Ratio and Resolution
| Format | Best For |
|---|---|
| 9:16 (vertical) | Instagram Stories, Pinterest, mobile viewing |
| 16:9 (horizontal) | Presentations, blog headers, LinkedIn |
| 1:1 (square) | Instagram feed, Twitter/X posts |
Specify resolution in pixels. "1K resolution" is ambiguous. "1080x1920 pixels" is not.
Color Palette
Provide hex codes for every color the infographic should use:
- Primary color: Headlines, key data points, primary icons
- Secondary colors: Supporting elements, charts, dividers (2-3 colors maximum)
- Background color: Usually light neutrals work best for readability
- Text color: Near-black (#1F2937) on light backgrounds, white (#FFFFFF) on dark
Limiting the palette to 4-5 colors prevents the chaotic look of default AI outputs.
Typography Instructions
AI models interpret font requests loosely. Instead of naming specific fonts, describe characteristics:
- "Bold condensed sans-serif" rather than "Helvetica Bold"
- "Elegant serif with moderate contrast" rather than "Garamond"
- Specify relative sizes: "Headlines 2x larger than body text"
Always include: "All text must be legible and correctly spelled." Nano Banana Pro handles text better than previous models, but explicit instructions improve consistency.
Layout Constraints
Unconstrained layouts produce cluttered results. Specify:
- Maximum number of sections (3-5 works well)
- Whitespace requirements ("generous margins," "20% padding")
- Element positioning ("title in top 15%," "data in center third")
- Flow direction ("information flows top to bottom")
Illustration Style
This is where AI infographics typically fail. Reference specific visual styles:
| Style | Description |
|---|---|
| Minimal line-art | Single-weight strokes, no fills, technical drawing aesthetic |
| Flat design | Solid color shapes, no gradients or shadows |
| Hand-drawn | Organic lines, slight imperfection, sketchbook feel |
| Isometric | 3D projection without perspective, consistent angles |
| Editorial illustration | Magazine-style, sophisticated color relationships |
You can also reference publications: "illustration style similar to The Economist's data visualizations" or "icon style matching Material Design guidelines."
Iterating on Results
Nano Banana Pro supports conversational editing. After receiving your first infographic, request specific changes:
Adjusting layout:
Move the title to center alignment and increase spacing between sections.
Fixing text issues:
The third bullet point text is cut off. Regenerate with shorter line lengths.
Changing visual elements:
Replace the pie chart with a horizontal bar chart. Keep all other elements.
Regenerating entirely:
This didn't capture the style. Generate again with more emphasis on whitespace and cleaner icon lines.
Each iteration builds on the previous conversation context, so you don't need to re-specify your style guide.
Troubleshooting
Symptom: Text appears garbled or misspelled Fix: Add explicit instruction: "Ensure all text is spelled correctly and fully legible. Double-check spelling before rendering." If text is long, break it into shorter phrases.
Symptom: Colors don't match specified hex codes Fix: Provide color names alongside hex codes: "#2563EB (bright blue)" helps the model interpret your intent.
Symptom: Layout ignores whitespace instructions Fix: Add numerical constraints: "Minimum 40 pixels between all elements" or "No more than 60% of frame should contain content."
Symptom: Illustration style reverts to clip-art Fix: Add negative constraints: "No 3D renders, no gradient fills, no stock illustration style, no cartoon characters."
Symptom: Infographic includes information you didn't provide Fix: Add: "Use only the content I have provided. Do not add facts, statistics, or text not included in my prompt."
What's Next
Save your style specification as a text file. Paste it at the start of any new Gemini conversation when you need brand-consistent infographics. For teams, this specification becomes a shared asset ensuring visual consistency across creators.
For more control over output (including removing the Gemini watermark), explore Google AI Studio, which offers the same Nano Banana Pro model with additional parameters and API access.
PRO TIPS
- Structure complex style specifications in JSON format for cleaner organization and reusability across projects (Gemini parses JSON prompts reliably)
- Use
Shift+Enterin Gemini to add line breaks within your prompt without sending it - Paste your style specification first, wait for acknowledgment, then paste content in a separate message
- For data-heavy infographics, format numbers consistently in your source content (all percentages, all decimals to same place)
- Export infographics at 2x resolution if you plan to crop or edit in other tools
- Request "one infographic per message" when generating multiple variants to maintain quality
COMMON MISTAKES
- Sending everything in one prompt: Gemini handles large prompts, but separating style from content produces more consistent results. The model can focus on one task at a time.
- Using vague color descriptions: "Use blue" gives inconsistent results. "#1E40AF" gives exact results. Always provide hex codes.
- Overloading content: Infographics with 8+ sections become unreadable at any resolution. Edit your content to 3-5 key points before prompting.
- Skipping the negative constraints: Without "no clip-art, no 3D renders," the model defaults to generic illustration styles. Always specify what you don't want.
PROMPT TEMPLATES
Data Summary Infographic
Use Nano Banana Pro. Create a 9:16 infographic.

STYLE: Minimal, editorial, flat design. Background #FAFAFA. Primary color #0F172A. Accent #3B82F6.

TITLE: [Your Title]

DATA POINTS:
- [Stat 1]: [Number]
- [Stat 2]: [Number]
- [Stat 3]: [Number]

Present each data point with a simple icon and large number. Ensure all text is legible. Use generous whitespace.
Customize by: Replacing the DATA POINTS section with your statistics
Example output: A clean vertical infographic with three data callouts, each featuring a line-art icon, bold number, and brief label
Process Flow Infographic
Use Nano Banana Pro. Create a 9:16 infographic.

STYLE: Hand-drawn aesthetic on cream paper background (#FFF8F0). Dark brown text (#44403C). Simple line illustrations.

TITLE: [Process Name]

STEPS:
1. [Step one description]
2. [Step two description]
3. [Step three description]
4. [Step four description]

Show steps flowing vertically with connecting arrows. Each step gets a small illustration. All text must be correctly spelled.
Customize by: Adjusting the number of steps (keep between 3-6 for readability)
Example output: A vertical flow diagram with numbered steps, hand-drawn style icons, and organic arrow connectors
Comparison Infographic
Use Nano Banana Pro. Create a 1:1 square infographic.

STYLE: Split design, modern. Left side #EFF6FF background, right side #FEF3C7 background. Dark text #1F2937.

TITLE: [Topic A] vs [Topic B]

LEFT COLUMN ([Topic A]):
- [Feature 1]
- [Feature 2]
- [Feature 3]

RIGHT COLUMN ([Topic B]):
- [Feature 1]
- [Feature 2]
- [Feature 3]

Use matching icons on each side for comparison. Clear visual separation between columns.
Customize by: Changing the background colors to match each topic's brand or association
Example output: A square infographic divided vertically, with parallel features on each side and matching iconography
FAQ
Q: Does the free Gemini tier work for this? A: Yes. Free accounts access Nano Banana Pro with limited daily generations and a small watermark on outputs. The watermark appears in the corner and can be cropped if needed.
Q: Can I upload reference images for style matching? A: Nano Banana Pro accepts up to 14 reference images. Upload examples of infographics you like and add: "Match the visual style of these reference images." This works well for replicating illustration styles or color relationships.
Q: How do I remove the watermark? A: Use Google AI Studio instead of the Gemini app. AI Studio provides the same model without watermarks, though it requires payment based on usage (approximately $0.15-0.25 per image).
Q: What's the maximum text length for infographics? A: No hard limit, but legibility suffers past 150-200 words. Edit your content to essential points before prompting. If you have more content, consider creating a series of infographics.
Q: Can I generate infographics from PDFs or articles? A: Yes. Paste the text content directly into your prompt or upload the document. Add: "Extract the key points from this content and visualize them as an infographic." Gemini will summarize and visualize.
Q: Why does my infographic have made-up statistics? A: Gemini may add information if not explicitly told otherwise. Include: "Use only the content I provide. Do not add any statistics, facts, or text not in my prompt."
RESOURCES
- Nano Banana Pro Official Launch Post: Google's announcement with capability overview
- Gemini Prompting Tips: Official prompting guide from Google
- Gemini Image Model Documentation: Technical specifications and example prompts
- Google AI Studio: Alternative interface with more control and no watermarks